
Article Snapshot
What this article covers
A capacity number is a claim until it is tied to a demand profile, a process constraint and a ramp plan. This guide gives buyers a readiness review that separates installed capacity from what a supplier can actually deliver in the weeks that matter.
- Translate the annual forecast into a monthly and weekly profile.
- Identify the step that limits output, not the headline machine.
- Separate installed capacity from usable capacity.
- Ask for ramp evidence and a recovery plan.
The question "how many can you make per month" produces a number, and the number is almost always larger than the first month of a new program. That is not necessarily dishonesty. A supplier may be describing installed capacity at maturity, with tooling proven, shifts staffed and yield stabilized. The buyer hears a promise about the start of production, when none of those conditions is fully true yet.
This guide is about closing that gap. It covers how to turn a forecast into a demand profile, how to find the process step that actually limits output, how to separate installed from usable capacity, what to examine in tooling and staffing, how to plan and evidence a ramp, and how to test recovery. It avoids published capacity or OEE benchmarks, because those are meaningful only against a specific product, tool and operating pattern.
1. Convert the forecast into a demand profile
An annual volume is a planning input, not a production requirement. The supplier needs to know how the volume is distributed: a steady monthly rate, a launch spike, a seasonal peak or a model mix that changes through the year. Two programs with the same annual total can place very different demands on a press line.
Build a monthly profile for the first year and a weekly profile for the launch quarter. Mark the peak, the ramp slope and any step changes from model introductions. Include the variants: a program with three back-plate sizes and two surface finishes has a different changeover burden than one with a single part. Include the spare and service demand if it draws on the same line.
Share the assumptions behind the forecast. If the peak depends on a customer launch date that may move, say so. A supplier that plans for a peak on a fixed date and then receives it three weeks early has a different problem than one that was told the date was uncertain. The demand profile is a shared planning document, not a single number passed over a spreadsheet.
2. Map the process and find the real constraint
Capacity is limited by one step at a time. In a stamping operation it might be the press, the die change, the coil handling, the deburring, the coating line or the inspection station. In a molded part it might be the machine, the tool, the drying, the assembly or the packing. The headline equipment is often not the constraint, because it is the step everyone watches.
Map the route from raw material to shipment and estimate the available time at each step. Then compare the required output at the peak. The step with the least headroom is the constraint, and it is where the ramp plan should focus. A supplier that adds a press but leaves a single manual finishing station unchanged has not added capacity where it matters.
Walk the floor rather than reading a capacity table. Watch how parts move, where they wait, how often a die is changed and who does the inspection. The queues reveal the constraint more reliably than the equipment list, because a queue forms in front of the step that cannot keep up.
3. Separate installed capacity from usable capacity
Installed capacity is what the equipment could produce under ideal conditions. Usable capacity accounts for changeovers, maintenance, breaks, quality losses, material availability and the product mix. The gap between the two is where most launch surprises live.
Ask for the assumptions behind any capacity figure: the number of shifts, the available hours per shift, the planned downtime, the changeover time, the scrap allowance and the product mix. A figure quoted for a single part running continuously is not the same as one quoted for a mix with frequent changeovers. If the supplier cannot state the assumptions, the number cannot be compared with another supplier's number.
ISO 22400-1 and ISO 22400-2 provide a framework and definitions for manufacturing operations KPIs, including overall equipment effectiveness. The standard defines terms; it does not supply a target value. A supplier's OEE figure is only useful if the definitions, the measurement period and the included losses are known. Otherwise it is a label rather than evidence.
4. Check tooling, equipment, people and outsourced steps
Tooling readiness is a capacity question as much as an engineering one. How many tool sets are available, is there a spare, how long does a repair take, and who owns the tool? A single tool with no backup is a single point of failure at the ramp, when the tool is also the least mature.
Equipment readiness includes the press tonnage and bed size, the die height, the handling equipment and the coating line. A press that can physically fit the tool may still be too slow, or may lack the cushion or the automation the process needs. Check the actual machine against the process requirement rather than against a general tonnage rule.
People and outsourcing complete the picture. A new program needs trained operators, die setters, inspectors and maintenance staff, and those people may be shared with other programs. External processes such as coating, plating or printing add lead time and a separate capacity constraint. Ask how the outsourced step is scheduled and what happens when it is late.
5. Plan the ramp curve and the pilot run
A ramp is not a step from zero to full rate. It is a period in which output, yield and stability improve as the team learns the tool and the process. A production ramp-up performance study in the European Journal of Operational Research treats ramp-up as a distinct manufacturing phase that needs its own measurement, which matches what launch teams observe: the first weeks are a different operating regime.
Plan the ramp in stages with a defined output and exit criterion for each. A pilot run at a representative rate, a first production week at a lower rate, and a step to the target rate are typical stages. Each stage should have a quality gate, not only an output count. A supplier that reaches the rate with a high rework load has not really reached the stage.
Include the customer's own readiness in the plan. If the customer's receiving inspection, packaging line or assembly trial is not ready, the supplier's ramp will stall at the shipping door. The ramp plan is a joint schedule, and the handoffs deserve the same attention as the internal steps.
6. Test recovery from disruption
A capacity plan that works only when everything goes right is fragile. Ask what happens when a press goes down, a tool needs repair, a coating line is late or a key operator is absent. The answer should be a plan with a trigger, a responsible person and a time estimate, not a reassurance that it will not happen.
Recovery capacity can come from overtime, a second machine, an alternate process, buffer stock or a temporary external source. Each has a cost and a quality implication. Overtime depends on people who may already be stretched; a second machine may need a different tool; buffer stock consumes cash and space. The point is to know which lever exists before the disruption, not to invent one during it.
Test the plan with a tabletop exercise. Pick a realistic failure, walk through the response and see where the plan breaks. A supplier that can describe the sequence, the notification and the recovery time is more credible than one that promises zero interruptions.
7. Ask for evidence, not adjectives
"Strong capacity", "rich experience" and "stable quality" are not evidence. Evidence looks like a capacity calculation with assumptions, a tool list with condition and ownership, a staffing plan by shift, a ramp curve from a comparable program, a maintenance record, a sample inspection report and a named person for each escalation.
Comparable programs are more useful than general claims, with the caveat that a different part is not proof for this one. Ask what was similar: the material, the size, the tool complexity, the surface requirement and the volume. A supplier that can explain the differences is more credible than one that presents every past program as identical.
Planning table, not an audit checklist: the questions below are a starting structure for a readiness review.
| Readiness area | Question to ask | Evidence to request | Warning sign |
|---|---|---|---|
| Tooling | How many tool sets, and what is the spare plan? | Tool list, condition, ownership | Single tool, no repair history |
| Press and equipment | Which machine, and is it available at the peak? | Machine schedule, tonnage and bed data | Capacity quoted without a machine |
| Downstream steps | What limits output after forming? | Route map, queue observations | Focus only on the press |
| People | Who runs and maintains the line? | Shift plan, training record | Shared staff with no backup |
| Outsourced process | Who does it, and what is the lead time? | Supplier list, capacity, quality record | Unnamed or single-source step |
8. Use KPIs with agreed definitions
KPIs are useful when both parties define them the same way. Output, yield, on-time delivery, changeover time and OEE each have several possible definitions. A yield that excludes rework is different from one that includes it. An on-time metric that measures shipment from the supplier is different from one that measures receipt at the customer.
Agree the definitions before the first report, and agree the reporting period and the data source. A monthly OEE calculated from machine counters is not the same as one calculated from production records. The purpose is not to compare suppliers on a league table but to see whether the process is stable and improving.
Keep the set small. A handful of measures that the team actually uses is more valuable than a dashboard that nobody reads. For a ramp, the most useful measures are output against plan, first-pass yield, rework volume, downtime and the age of open issues. Those show whether the ramp is real.
9. Work through a hypothetical ramp shortfall
Hypothetical planning example, not a KINGSUN customer case: a new back-plate program reaches only about 70 percent of the planned rate in the first four weeks. The initial assumption is that the presses are too few, and the discussion turns to adding a machine.
A route walk shows that the presses are not the constraint. The finishing station that removes a small edge burr by hand is staffed by two people and is the step where parts queue. The press output is adequate, but the finishing rate is not, and the queue grows through each shift. Adding a press would have increased the queue, not the shipments.
The team adds a second finishing position, changes the fixture to reduce handling time and moves one inspector to the station during the peak hours. The rate recovers over the following weeks. The lesson is that the constraint was found by watching the floor, not by comparing machine counts, and the fix was cheaper than the equipment that was first proposed.
10. Build the readiness review and the RFQ package
Bring the demand profile, the route map, the capacity assumptions, the tooling list, the staffing plan, the outsourced steps, the ramp curve and the recovery plan into one review. Give each item an owner and a status. The review should end with a clear statement of what is proven, what is planned and what is still an assumption.
For the RFQ, include the monthly and weekly demand, the peak and its date, the variants and changeover expectations, the tooling ownership model, the validation requirements and the delivery destinations. Ask the supplier to respond with a capacity calculation and a ramp plan, not only a unit price. A quote that cannot explain how the volume will be produced is incomplete.
The structural components RFQ guide covers the full input list, the tooling trial guide covers the transition from samples to production, and the OEM/ODM process overview describes how KINGSUN coordinates a program. A specific readiness question can be raised through the project contact or reviewed against the manufacturing scope.
11. Sources and engineering boundaries
These references support the framework used above. They do not provide a capacity figure, a target OEE or a benchmark for a television structural part.
- ISO 22400-1:2014 — Manufacturing operations management: KPIs and ISO 22400-2:2014 — definitions: framework and definitions, including OEE.
- European Journal of Operational Research — performance measurement during production ramp-up: cross-industry research treating ramp-up as a distinct phase.
- ISO 9001:2015 — Quality management systems: background for process control and records; not a capacity standard.
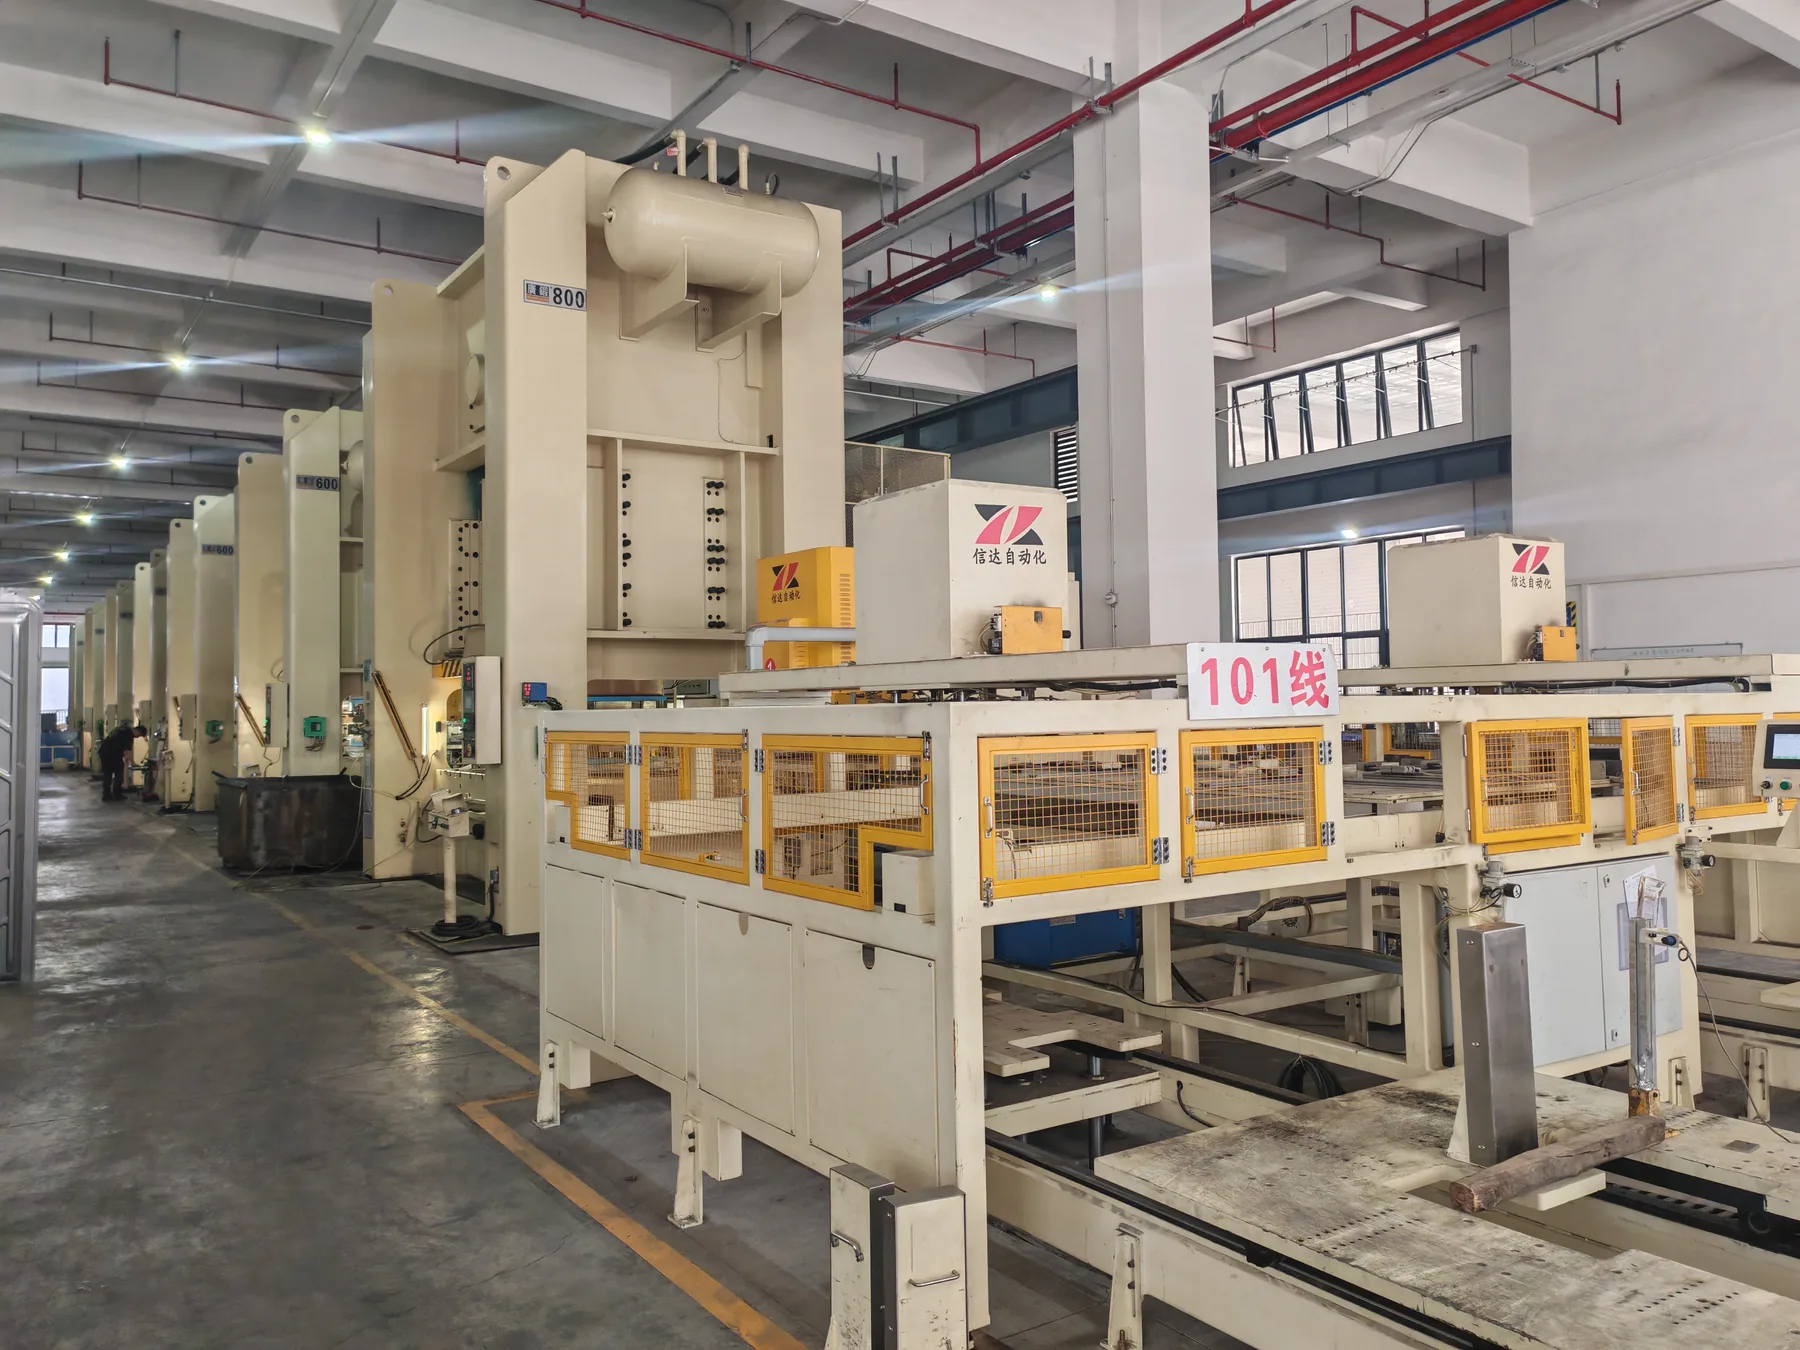
The cover shows a stamping line in supplied company materials. It does not evidence capacity, cycle time, OEE or a customer program, and the ramp shortfall is hypothetical. Capacity and readiness must be established for the actual part, tool, machine and demand profile.